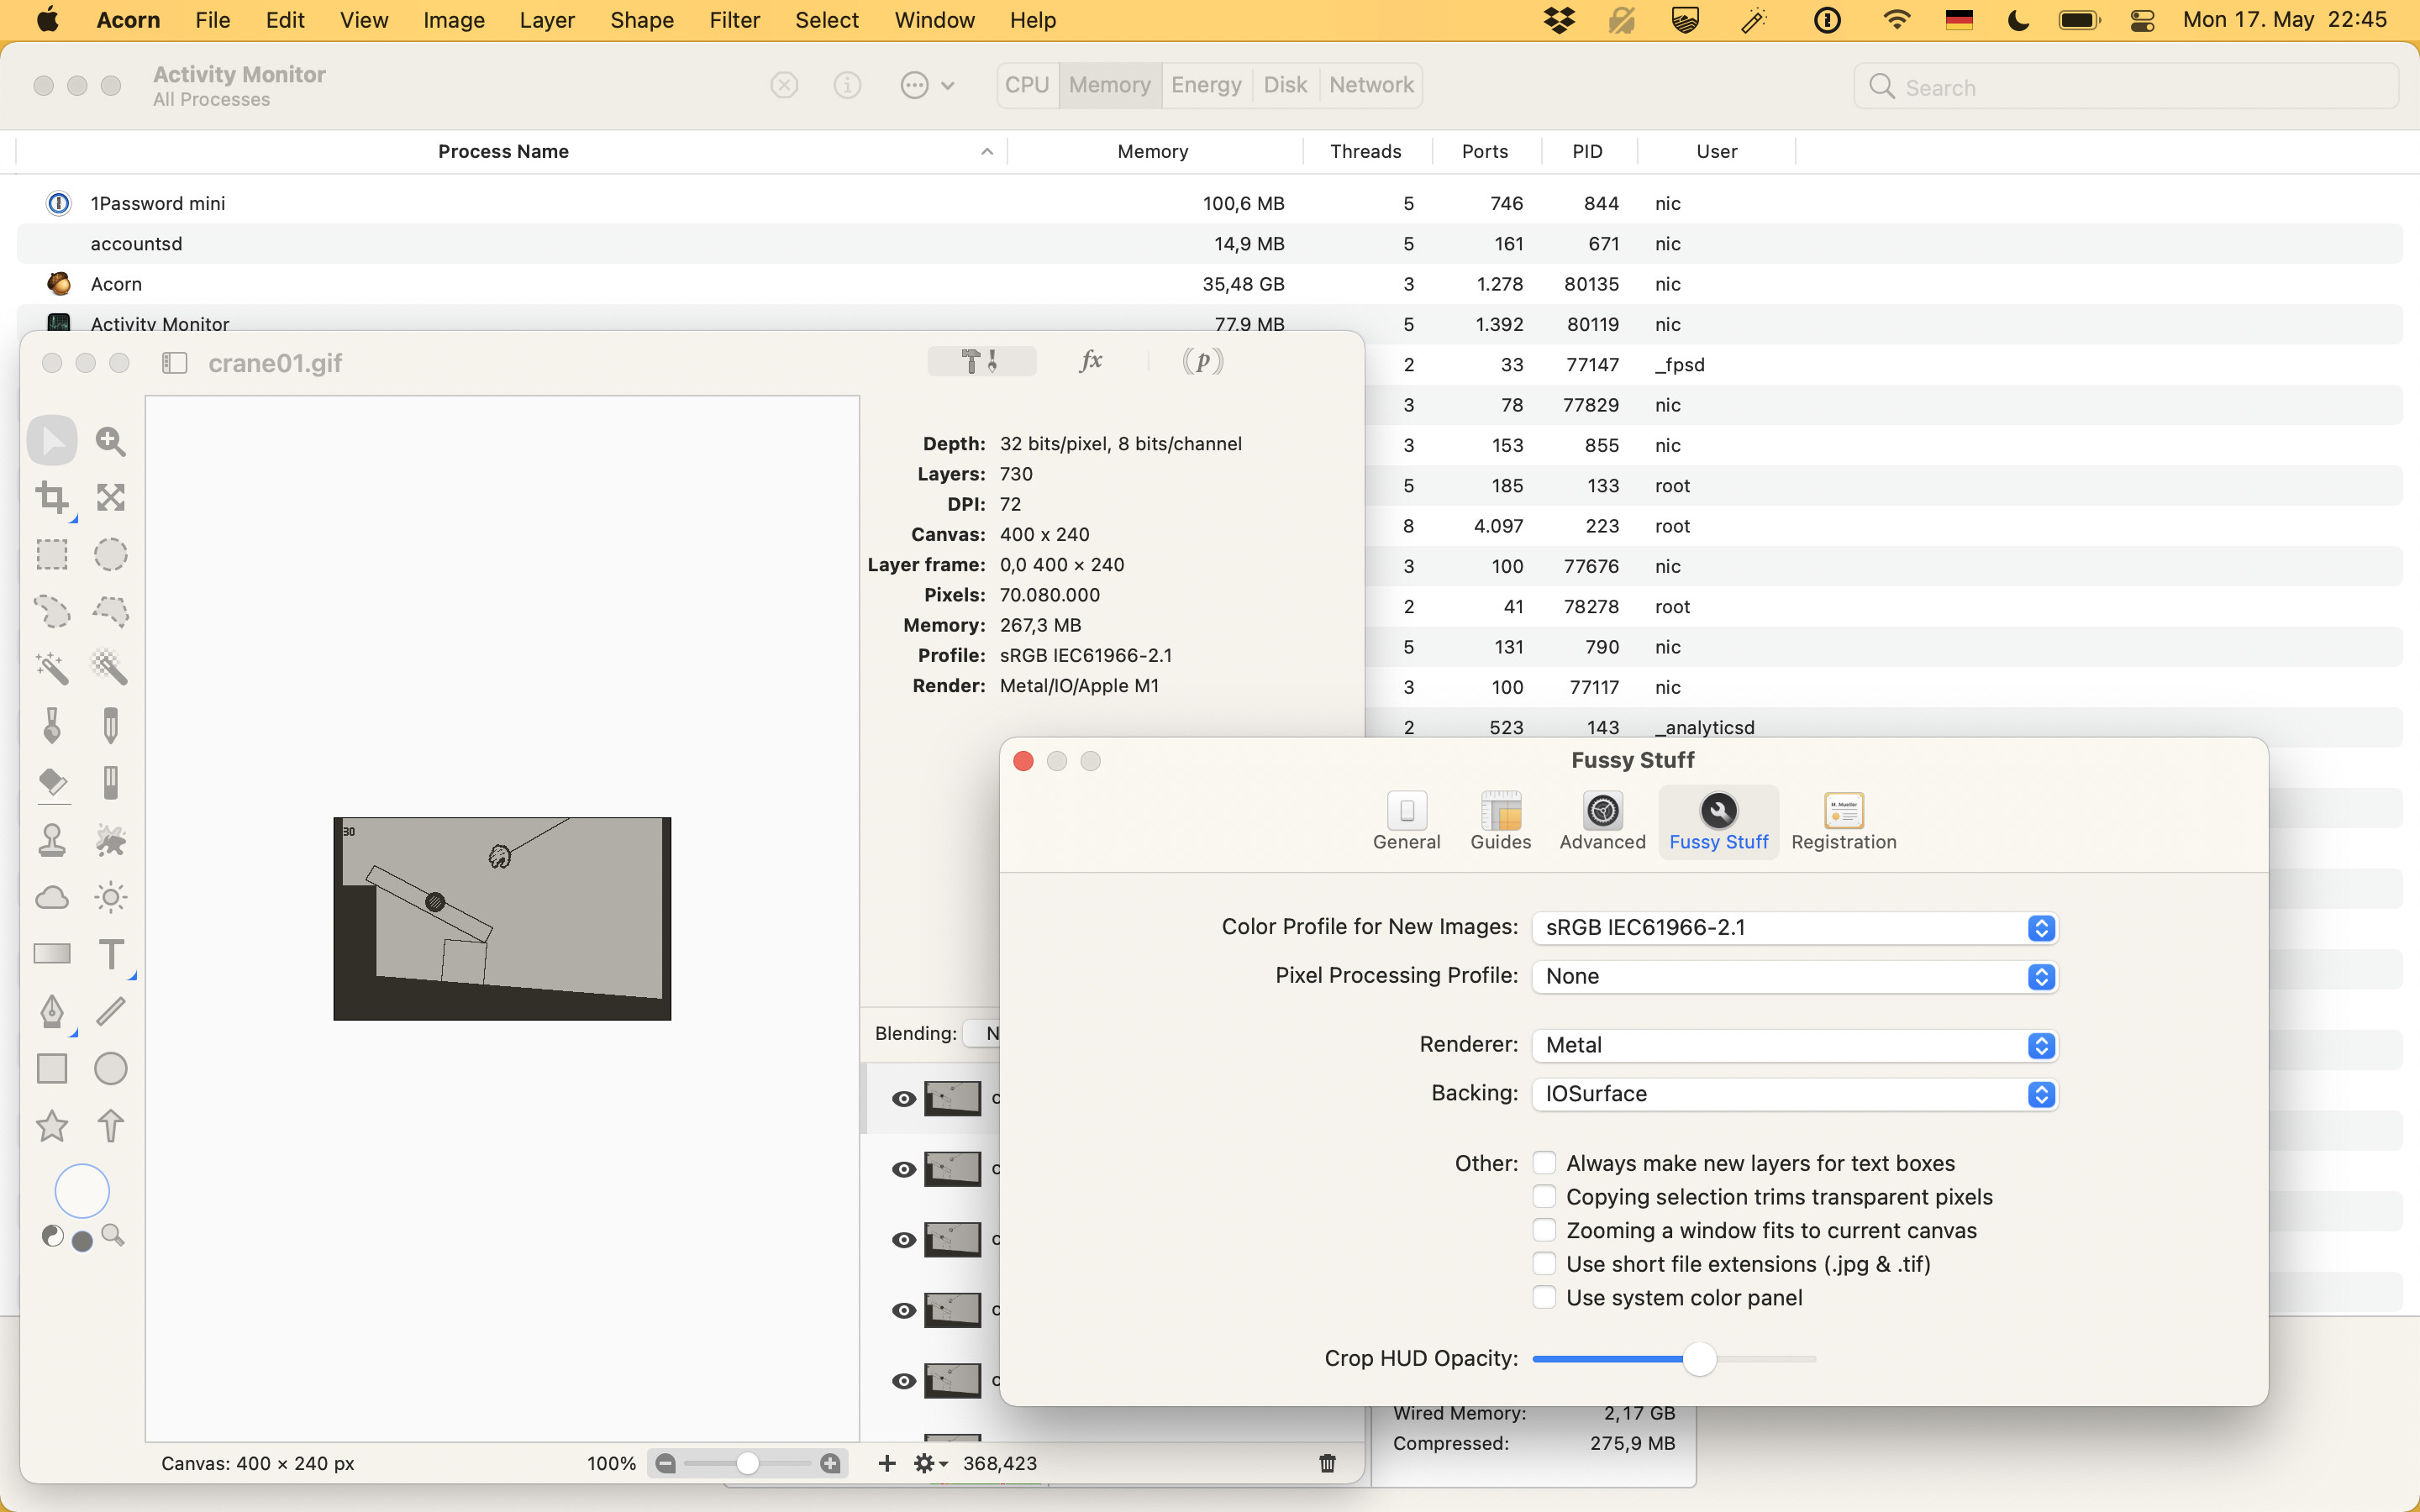
When I open the following gif in Acorn, my system is complaining I run out of Application memory and it seems Acorn allocates nearly 40GB of memory.
The gif has quite some frames (730) so I understand this is not lightweight especially since animated gif is mainly a convenient addition but not necessarily its core feature. But I am still surprised it is that demanding.
Is it something that can be improved in the future?
I think there’s something else going on. When I open up that GIF on my end, Acorn is only taking up about 230MB of memory.
Can you tell me specifically which version of Acorn you’re using? And what version of MacOS? And if you open up Acorn’s preferences, click on the Fussy Stuff tab, what do the Renderer: and Backing: options say?
Acorn Version 7.0.3 (15840)
macOS 11.2.1 (20D74)
MacBook Air (M1, 2020)
Renderer: Metal
Backing: IOSurface
To note that if I just save one frame, open it and manually duplicate layers (768), I do get a similar memory consumption in the image property, but in the activity monitor it is just around 1GB and not 40GB.
OK, this is apparently an M1 issue. I try it over there and it’s taking up 35GB for me. This is … concerning. This sounds like a (very bad) memory leak in one of Apple’s frameworks, and I’ll get it reported to them. Are you OK with me using your image in a bug report?
After doing some more digging on this, I think Activity monitor is smoking something. If you bring up the other memory columns, nothing is too out of the ordinary.
I’ll still get it reported to Apple, but I think the reporting mechanism might be off by quite a bit.
Yeah I had the same impression too that this number doesn’t add up. But that’s not just Activity Monitor, the system as a whole think it uses that much memory.
I’ve narrowed it down quite a bit (and submitted it to Apple as FB9112835).
What’s going on is that the IOAccelerator framework has some sort of massive leak in it, where it’s using up 35GB of ram, 25 of which is going to swap (which is why you’re seeing kernel_task flake out).
On intel, the same image only uses 1480K from IOAccelerator.
This is … kind of crazy! I’d love to know what is going on.
Alright - I think I have this fixed in the latest builds and for the upcoming release of 7.0.4. When you get a chance, can you grab the latest build from here and let me know how it works for you? Latest Builds from Flying Meat